Plugin DSP Load
The Plugin DSP Load window is helpful in cases where some of the plugins need too much CPU time to process buffers, resulting in audible clicks and pops in the output, but you aren't quire sure which ones are causing this exactly or you do know, but you need actual stats.
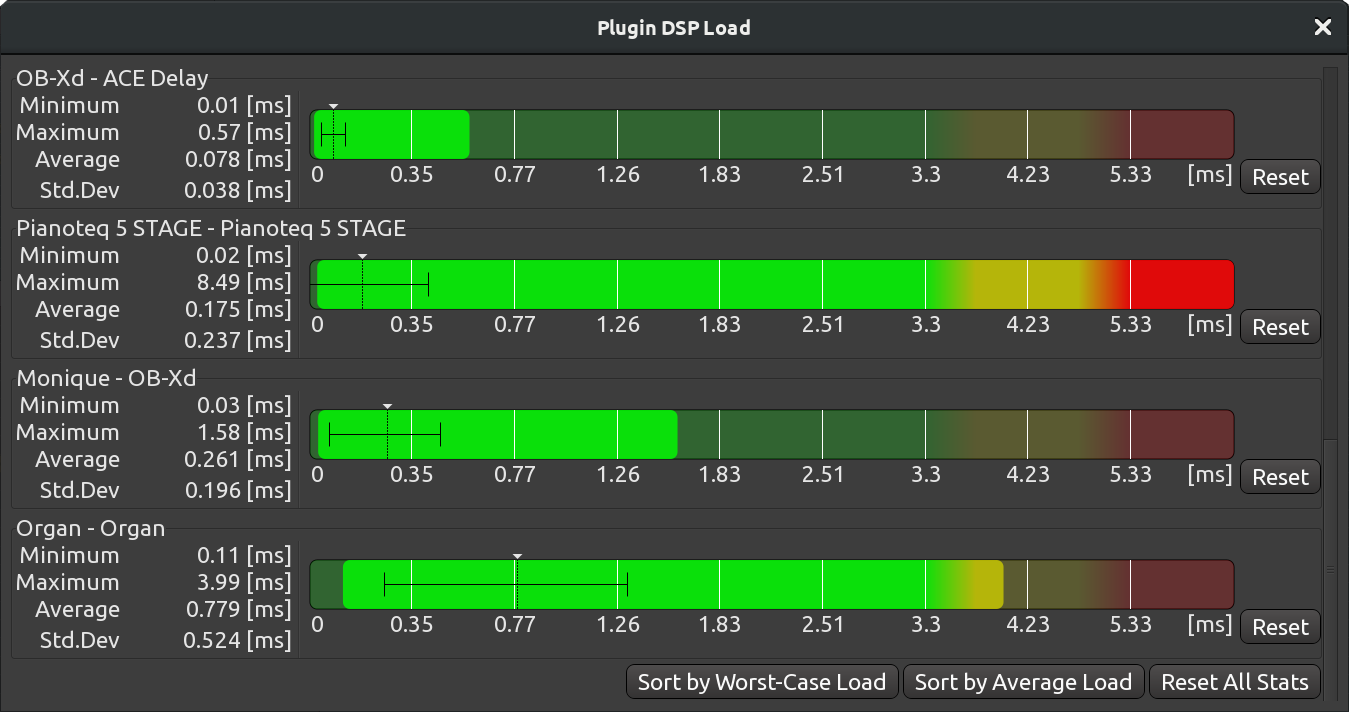
For each plugin in use, there is a chart and numeric data that represents minimum, maximum, and average CPU time used, as well as standard deviation. This, along with simple color coding — green for safe amount of CPU time, red for too much CPU time required — gives you a good overview of what's going on in the session.

The Plugin DSP Load window has basic sorting options: by worst-case load or by average load. This helps easily locating the worst offenders. You can also click to reset all stats.
You can use the data provided by the Plugin DSP Load window to decide whether you want to replace a plugin with a less resource-hungry one, freeze a track, or report a potential bug to the plugin's developer and wait for an update.
It's worth noting that certain type of plugins, like convolution reverbs and guitar amp simulators, tend to consume more resources.