Realtime Perceptual Analyzer
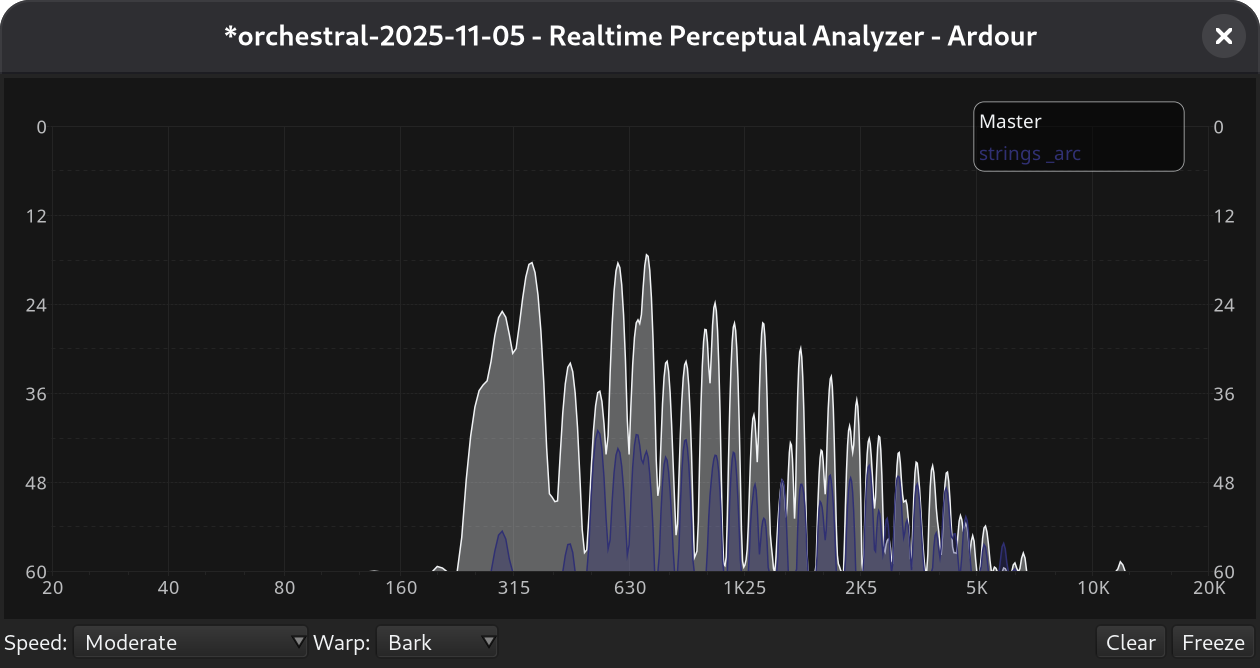
The built-in perceptual analyzer allows one to visualize the live spectrum of multiple tracks and/or busses.
The overlaid visualization of multiple sources helps discover which track contributes a given of frequency range to the overall mix, find conflicting ranges or holes in the spectrum.
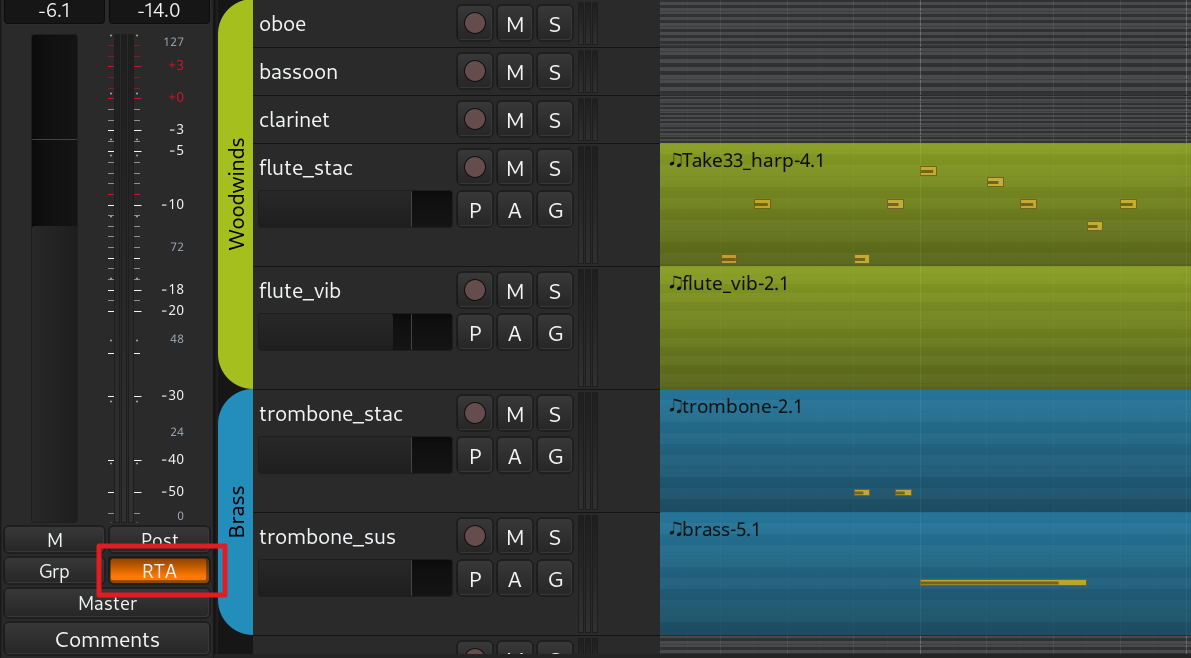
Adding sources to analysis
By default, the real-time analyzer (RTA) window displays the spectrum of the signal coming out of the master bus. To add more sources, toggle the RTA button on either the Editor Mixer or the channel strip in the Mixer window. This will add a new source to the analyzer and open the RTA window.
Reading the spectrum display
The perceptual analyzer displays how much power (dB) each part of the sound spectrum (Hz) contains. The horizontal axis represents frequency from low (20Hz) on the left to high (20kHz) on the right, while the vertical axis shows power level going from 0dB at the top to -60dB at the bottom.
By default, the RTA window displays values in the 0dB..-60dB range. To see the opposite ends of the power range (0db to 6ddB and -60dB to -80dB), hover over the right side of the dialog and use the scrollbar.
You can also drag the top and the bottom ends of the scrollbar position indicator to zoom in and out.
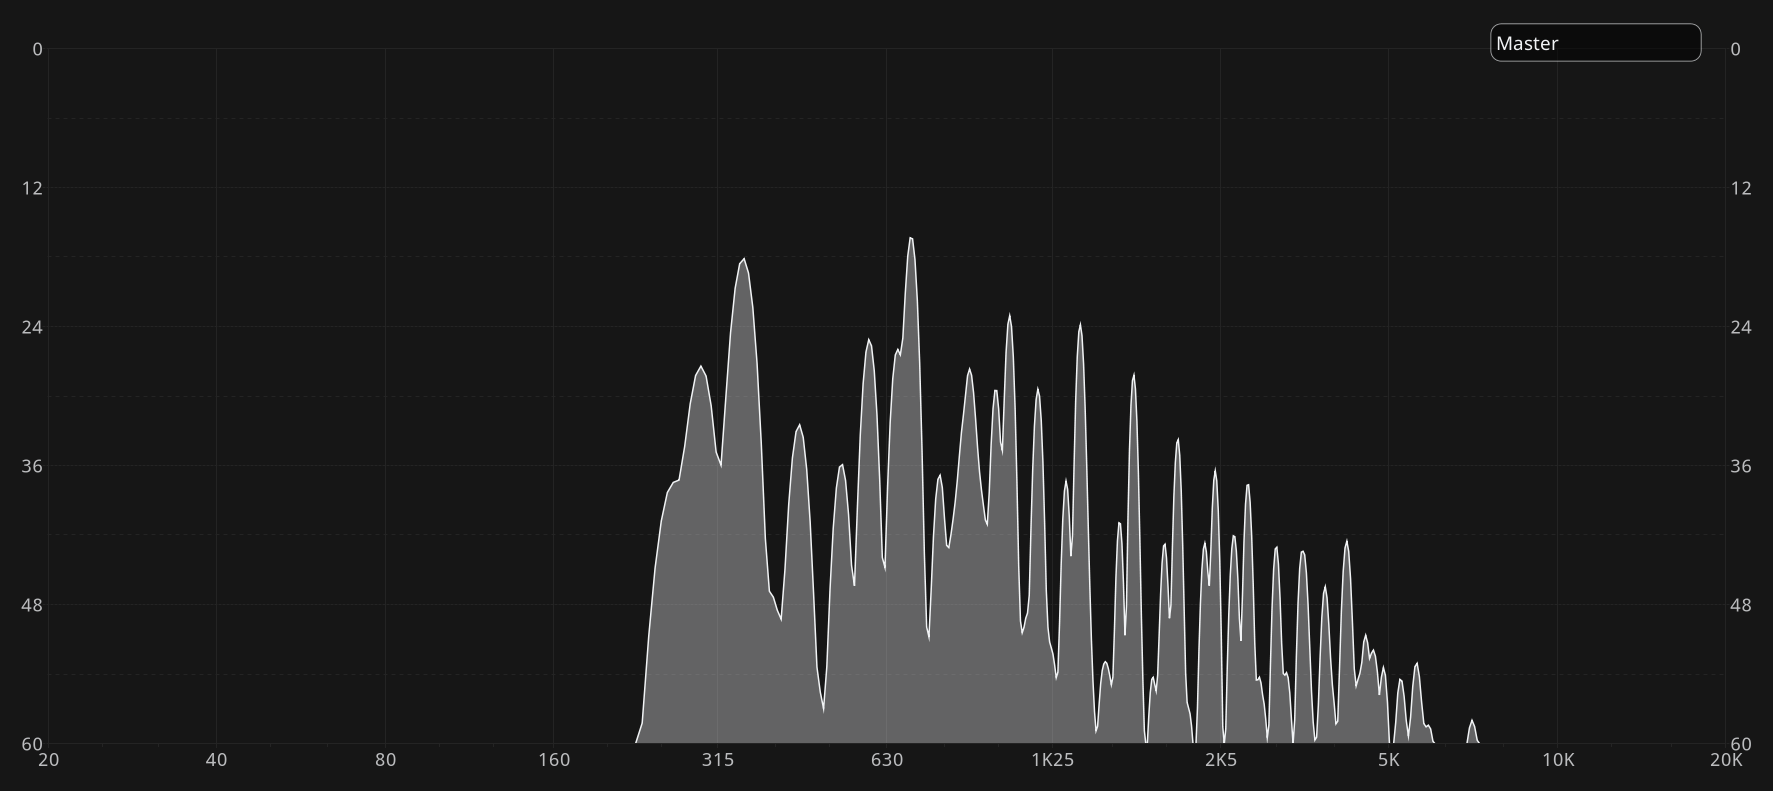
Taller "peaks" indicate frequencies with more power, while "valleys" show frequencies with less power.
Hovering over the chart displays the frequency/power pair at the bottom of the dialog numerically.
As audio plays, the display updates continuously. It's possible to temporarily pause the visual update of the spectrum display to inspect it in detail. There are two ways to do it:
- Left-click and hold freezes pauses the update until you release the mouse button. THis is useful when you only need a quick inspection.
- Clicking on the Freeze button pauses the update until you click the button again. This is useful when you need to go into details and hover spectrograph to see the frequency/
Removing sources from analysis
To remove selected sources from analysis, toggle the RTA button in respective mixer channels.
To remove all sources except the master bus, click on the Clear button in the RTA window.
Real-time analyzer options
The real-time analyzer has two options:
- Speed: Sets the analysis return time, or how many dBs fall in a given period, from 1dB in 2 seconds for the Noise Measurement mode to 96dB/s for the Fast mode.
- Warp: Warps spectrum frequencies to focus on given range. A high warp factor increases resolution in the low frequency range, while the Bark scale is a frequency scale on which equal distances correspond with perceptually equal distances.
Controlling RTA performance
Real-time spectrum analysis is CPU-intensive. You can control how many spectrum displays Ardour should attempt to handle simultaneously. The Limit concurrent RTA spectra setting is available on the Metering page of the Preferences dialog.